Axpert 11
TStructs (Forms)
- Create Form
- Create DC
- Create Fields
- Grid DC/frames
- Formulae in fields
- SQL in fields
- Drop down fields
- Autogenerate fields
- Table fields
- File upload fields in forms
- Photos &Image fields
- Fill Grid
- Posting data – Gen maps
- Updating fields in DB tables – MD Map
- Toolbars in tstructs
- Tracking changes/Audit trial
- Try it yourself
IViews
Scripts
Axpert Jobs
Axpert Cards
HTML Plug-ins
Users & Roles
- Users, roles & responsibilities
- Responsibilities
- User Role
- User Login
- SSO Authentication
- Stay Sign In
Workflow
Axpert API
Application Var/Params
Publish Axpert Apps
Axpert Mobile
Settings
- Axpert installation
- Change password
- Forgot Password
- Developer Options
- Global Settings
- In-Memory DB
- Notifications for Long Running Webservice’s
- Axpert Configuration on web
- Axpert Licensing
Utilities
Customization
- Main Page Customization
- Home Page Customization
- More API
- Custom User Interface
For Reports - Custom HTML In Forms
- CSS And JS Customization
- Developer Notes
- Hooks In Forms
- Third Party SSO Integration
WebServices
Axfast
Create Reports with Axfast
- Report Objects
- Report Example
- The Text Object
- HTML Tags in Text object
- Displaying expressions with the help of the “Text” object
- Bands in Fast report
- Data Bands
- Customer List report
- Aliases
- Variables
- Picture Object
- Report with Picture
- Multi-lined text
- Report with two data levels
- Headers and Footers
- Multi-page reports
Report Objects
The FastReport Designer represents reports as a collection of schematic pages. Objects are placed anywhere on the report pages and are used to define the report’s appearance and to display various information, such as text and graphics. FastReport objects which are included in the standard package are:
![]() – “Band” object: an area on a design page that behaves according to its type (e.g. Header band, Data band)
– “Band” object: an area on a design page that behaves according to its type (e.g. Header band, Data band)
![]() – “Text” object: displays one or more lines of text within a rectangular area
– “Text” object: displays one or more lines of text within a rectangular area
![]() – “Picture” object: displays a graphic file in “BMP,” “JPEG,” “ICO,” “WMF” or “EMF” format
– “Picture” object: displays a graphic file in “BMP,” “JPEG,” “ICO,” “WMF” or “EMF” format
![]() – “Line” object: displays a horizontal or vertical line
– “Line” object: displays a horizontal or vertical line
![]() – “System text” object: displays either system information (date, time, page number, etc) or aggregate values
– “System text” object: displays either system information (date, time, page number, etc) or aggregate values
![]() – “Subreport” object: allows insertion of another report design page within the host page
– “Subreport” object: allows insertion of another report design page within the host page
![]() – “Draw” category object: displays various geometrical shapes (diagonal line, rectangle, rounded rectangle, ellipse, triangle, and diamond)
– “Draw” category object: displays various geometrical shapes (diagonal line, rectangle, rounded rectangle, ellipse, triangle, and diamond)
![]() – “Chart” object: displays data in various chart formats (pie chart, histogram, etc.)
– “Chart” object: displays data in various chart formats (pie chart, histogram, etc.)
![]() – “RichText” object: displays text in Rich Text Format (RTF)
– “RichText” object: displays text in Rich Text Format (RTF)
![]() – “CheckBox” object: displays a checkbox with either a tick or a cross
– “CheckBox” object: displays a checkbox with either a tick or a cross
![]() – “Barcode” object: displays data as one of several barcode types
– “Barcode” object: displays data as one of several barcode types
![]() – “OLE” object: displays any object using OLE technology.
– “OLE” object: displays any object using OLE technology.
Report Example
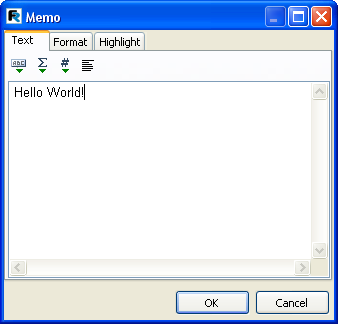
The example report will contain just one piece of information: “Hello, World!”. Open the report designer and click on the “Text” button in the Object toolbar. Move the mouse cursor over the page and click again. The object is inserted at the mouse position.
The text editor window will be opened right away; if it does not appear automatically then double-click the object. Text editor opening can be configured in the designer settings – see later on. Type in “Hello, World!” and then click the ОК button.
The report design is finished. To preview the report either select the “File>Preview” menu item or click the corresponding button in the toolbar. The preview window containing a report page with the “Hello, World!” text will appear. This report can be printed out, saved to a file (*.fp3), or exported to one of the supported export formats.
The Text Object
The “Text” object has many features. It can display text in a frame and be filled with a color. The text can be displayed using any font of any size and style. All the properties can be set visually with the help of the toolbars:
![]()
Here are some examples of text design:
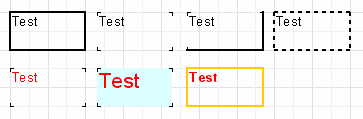
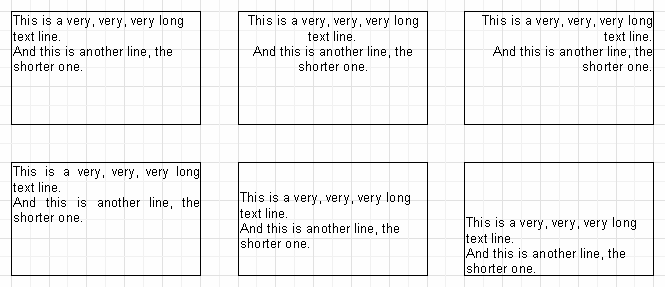
Enable the object frame from the toolbar and re-size the object up to 9×3 cm using the mouse. We see that the object can display not only a single line but also several lines of text. Now reduce the object width to 5cm. It is obvious that long lines did not fit across the object and were therefore wrapped. This is controlled by the “WordWrap” object property. If it is disabled (either in the object inspector or via the object context menu) any long lines will be simply cut short.
Now let’s see how text alignment inside the object works. Alignment buttons are located in the “Text” toolbar and control horizontal or vertical text alignment. Note the “Justify” button which lets you align paragraphs to both object edges – to do this “WordWrap” must be enabled.
HTML Tags in Text object
The “Text” object does understand some simple HTML tags. Tags can be located within the text of the object. Tags are disabled by default, but to enable them either select “Allow HTML tags” in the object context menu or enable the “AllowHTMLTags” property in the object inspector. Here is the list of supported tags:
<b> : bold text
<i> : italic text
<u> : underlined text
<sub> : subscript
<sup> : superscript
<font color> : font color
<nowrap> : text which is not split when “WordWrap” is enabled, the whole text is shifted to the next line
Please note that only a few tags are supported, but this should be enough for the majority of applications. It is not possible to modify the font size or name by means of HTML tags.
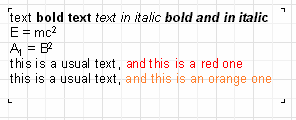
The following examples show how these tags can be used.
text <b>bold text</b> <i>text in italic</i> <b><i>bold and in italic</b></i>
E = mc<sup>2</sup>
A<sub>1</sub> = B<sup>2</sup>
this is a usual text, <font color=red>and this is a red one</font>
this is a usual text, <font color=”#FF8030″>and this is an orange one</font>
Displaying expressions with the help of the “Text” object
One of the most important features of this basic object is its ability to display not only static text but expressions as well. Expressions can be located within the object mixed in with normal text. Let’s see a simple example of how this works. Type the following into the object:
Hello, World! Today is [DATE].
When the report is run we can get something like this:
Hello, World! Today is 01.01.2022
How does this happen? When FastReport creates the report and encounters an expression enclosed in square brackets the report engine calculates the expression’s value and inserts this value into the text in place of the expression. “Text” objects can contain any number of expressions mixed in with the normal text. Complex expressions can contain brackets (for example [1+2*(3+4)]). Constants, variables, functions and DB fields can all be used in expressions. We will learn more about these later in the chapter.
FastReport automatically recognizes expressions enclosed in square brackets in the text. But what happens if our normal text contains square brackets which we do not want to be considered as expressions? For example, if we need to display the following:
a[1] := 10
FastReport would consider [1] as an expression and display the text as:
a1 := 10
which is not what we want, of course. One way to avoid this happening is to disable expression recognition. Disable the “AllowExpressions” property (or “Allow Expressions” in the context menu) and all expressions in the text will be ignored. In our example, FastReport would then display exactly what we need:
a[1] := 10
But sometimes text is required to contain both an expression and normal text with square brackets, for example:
a[1] := [myVar]
Disabling “AllowExpressions” lets us display square brackets in the required places, but it also disables the handling of expressions. In this situation FastReport allows you to use an alternative set of symbols to designate expressions. The “ExpressionDelimiters” property, “[,]” by default, is responsible for this. In our example we can use angular brackets for the expressions instead of square ones:
a[1] := <myVar>
The “<,>” value must be set in the “ExpressionDelimiters” property, where the comma is required to separate the opening and closing symbols. Another requirement is that the opening and closing symbols cannot be identical, so “%,%” will not work. Complex symbols can be used, for example “<%,%>”. So our example could look like this:
a[1] := <%myVar%>
Bands in Fast report
Bands are used for placing the objects they contain at particular locations on the output page. When placing an object in the “PageHeader” band we tell the report engine that the given object must be displayed at the top of each page in the finished report. Similarly, objects in the “PageFooter” band are displayed at the bottom of each page. Let’s demonstrate this with an example. We’ll create a report containing “Hello!” at the top of the page, the current date to the right of it, and the page number at the foot of the page on the right-hand side.
Open the FastReport designer and click the “New report” button in the toolbar. You will see a report template that already contains three bands: “ReportTitle”, “MasterData”, and “PageFooter”. Let’s remove the “MasterData” band for a while (click either on any free space inside the band or on its header and remove it with the “Delete” key or “Delete” in the context menu). Now let’s add a new band (“PageHeader”). Click the “Add band” button on the object toolbar and select “PageHeader” from the drop-down list. We see that a new band is added to the page. At the same time, the existing bands are moved down. FastReport designer automatically positions bands on the page – header bands at the top, data bands in the middle, and footer bands at the bottom.
Now let’s add some objects. Add a “System text” object to the “page header” band and in its editor select “[DATE]” from the System variable drop-down list (you should remember that the current date can also be displayed in a “Text” object by typing “[DATE]” in its editor). Next, add a “Text” object containing “Hello!” to the “ReportTitle” band. A “Text” object displaying the page number has already been automatically added to the “PageFooter” band.
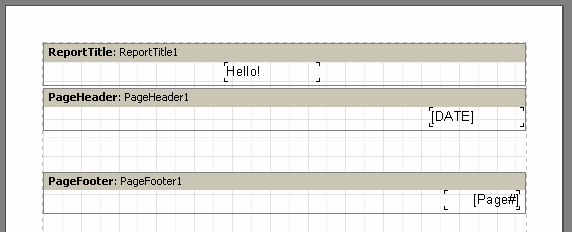
When running the report you will see that the objects in the finished report are printed in the proper positions on the page.

So, bands are responsible for positioning objects on the page. Depending on the type of band, we can print objects at the top or the bottom of a page and on the first or the last page. The basic bands needed in most reports work as follows:
- “PageHeader” band: displayed at the very top of each page
- “PageFooter” band: displayed at the very bottom of each page
- “ReportTitle” band: displayed at the top of the first page – this can be before or after the “page header” band, depending on the page’s “TitleBeforeHeader” property (found in the object inspector after clicking on any free space on the page)
- “ReportSummary” band: is displayed in the free space at the very end of the report
Data Bands
Query, the data is organized into lines (records or rows) that contain one or more columns (fields). To print this sort of data FastReport uses a special type of band, the various bands which are named “…Data”. To print a whole table or just some of its rows and fields, you must add one or more of these bands to the report, connect them to the table and place field objects within them. When FastReport builds the report, the bands will be printed on the output page, once for each record in the table. If there is no free space left on the output page for a band, a new output page will be created by the report engine before continuing.
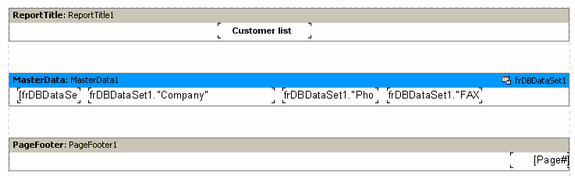
Customer List Report
Create a simple Customer report to display the following details.
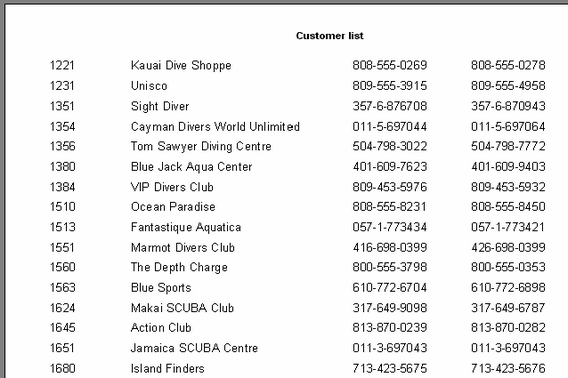
The report design will look like this
Aliases
In the previous report the data source was named frxDBDataSet1, the fields were named “CustNo,” “Company,” “Phone,” and “FAX” and we referred to them in the report using something like “[frxDBDataSet1.“CustNo””]”. Is this easy to understand? Not really. It would be clearer if the data source and the field were named “Our clients” and “Number” respectively. There is a problem, “frxDBDataSet1” is the name of the component, within which spaces are not supported and “CustNo” is the name of the field in the database, which cannot be changed without database restructure. However, there is a way around this. We can use pseudonyms or aliases for these items. In FastReport both the dataset and its fields possess a second name property known as UserName, i.e. an alias, which can easily be changed. Whenever a component has been given an alias (i.e. UserName changed from its default), this alias must be used in FastReport – the component’s Name property will not be recognized.
Move the mouse cursor over the “Text” object so that the button on the right-hand end of the object appears, click on the button and select the field from the list. Following this, the origin of the data in the dataset and its fields is more apparent.
It is better to assign aliases at the very beginning of the report design to avoid having to later rename all the fields within a report.
Variables
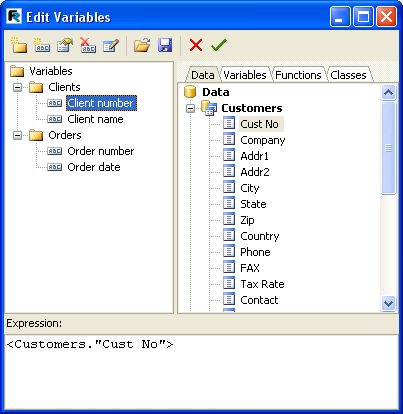
As well as aliases, there is another way to help the report designer set more understandable names for DB fields and other information elements. A DB field name or any expression can be associated with a variable. To create and work with variables in FastReport, select the “Report>Variables…” menu item, or click the “Variables” button in the toolbar.
The list of variables in FastReport has a two-level structure. The first level simply contains the category and the second level contains the variable itself. This categorization of variables is convenient when the list of variables is very long. A variable list must contain at least one category, which means that variables cannot be located at the top level. Furthermore, category names cannot be included in reports, so each name within the list must be unique.
Let’s illustrate the use of variables with the following example. Assume we have two data sources: the first is “frxDBDataSet1” with “CustNo” and “Name” fields and the second is “frxDBDataSet2” with “OrderNo” and “Date” fields. We can associate the following list of variables with the fields:
Clients
Client number
Client name
Orders
Order number
Order date
where “Clients” and “Orders” are two categories. Open the variables editor and create this structure by using of the “New category”, “New variable”, and “Edit” buttons. To link the variables to the DB fields select a variable and double-click on the required DB field in the right-hand pane. The link to the DB field will be shown in the bottom pane. The variable is now associated with this expression so the value of the variable becomes the value of the expression. If necessary, the expression can be edited or modified manually and any FR functions or other variables can be used within it. Remember that categories must not be associated with any expression.
After the list of variables has been created, close the variables editor. Now we can insert the variables into the report. In contrast to DB fields, there are fewer insertion methods. We can either insert a variable into the object text manually by typing “[Client number]”, or we can drag a variable from the “Data tree” pane onto the report page, in which case switch to the “Variables” tab in this pane.
Picture Object
The next object to look at is the “Picture” object. It is also frequently used in reports. Using this object you can insert logos, photos (e.g. of an employee) or any other pictorial information. The object can display graphics in “BMP”, “JPEG”, “ICO”, “WMF” or “EMF” format.
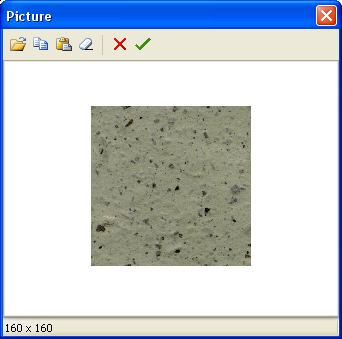
Let’s look at the capabilities of this object. Create a blank report and place a “Picture” object on the report page. If the picture editor does not open automatically then double-click on the “Picture” object. You can load any picture from a graphic file or clear the existing picture and close the editor by clicking on the green Tick.
Some of the object’s properties are available on the context menu as well as in the object inspector:
– AutoSize
– Stretch: enabled by default
– Center
– KeepAspectRatio: enabled by default
When “AutoSize” is enabled the object is re-sized up to the size of the picture it contains. Sometimes this can be useful if database pictures of differing sizes are being displayed. “AutoSize” is disabled by default.
“Stretch” is enabled by default. This property stretches the picture within the object. Change the object’s size using the mouse and you will see that the whole picture is always displayed within the object’s frame. If “Stretch” is disabled the picture (or only part of it) is displayed at its original size. This behavior differs from “AutoSize” in that you have control of the object’s frame size, which can be larger or smaller than the picture it contains. With “AutoSize” enabled you to have no control over the object’s frame size.
The “Center” property aligns the picture within the object.“KeepAspectRatio” is enabled by default: it keeps the picture from distorting when the object’s size is changed. This property is only effective when “Stretch” is also enabled. With “KeepAspectRatio” enabled a drawn circle remains a circle without turning into an oval, whatever the “Picture” object’s size. The stretched picture occupies only that part of the internal space of the object needed to display it with the correct aspect ratio. When disabled, the picture will be stretched to fill the object’s frame and will be distorted if the frame’s aspect ratio is not the same as the picture’s aspect ratio.
Report with Picture
The “Picture” object, like many objects in FastReport, can display data from a DB. This object can be connected to a DB field by setting the “DataSet” and “DataField” properties in the object inspector. In contrast to the “Text” object, this is the only way to connect this object to its data.
Create a blank project, place a “TTable” component on the form, and set some properties:
DatabaseName = ‘DBDEMOS’
TableName = ‘Biodata.db’
To work with this table in FastReport add a “TfrxDBDataSet” component and set these properties:
DataSet = Table1
UserName = ‘Bio’
Finally, add a “TfrxReport” component to the form. Open the report designer and click the “New report” button to create a basic design in FastReport. Now enable the use of the frxDBDataset and its connected table in the report – from the Menu select “Report>Data”, select the “Bio” dataset and click OK.
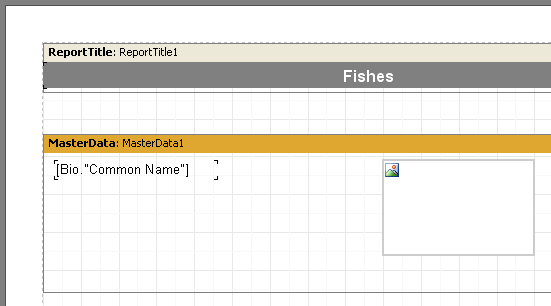
Now we’ll add objects to the report page. Place a “Text” object containing “Fish” in the “ReportTitle” band. Connect the “Master data” band to the data source (double-click on the band and select “Bio” from the list). Increase the band’s height to 5 cm by dragging the bottom of the band down or by using the object inspector. Place a “Text” object in the band and connect it to the “CommonName” field using any of the methods previously described. After that, drop the “Picture” object alongside and connect it to the “Graphic” field by setting its properties in the object inspector:
DataSet = Bio
DataField = ‘Graphic’
Multi-lined text
The “Notes” field will contain the multi-lined text of varying lengths but the “Text” object displaying the information from this field has a fixed size. This is why some lines appear to be cut off.Of course, either the size of the object could be increased or its font size could be reduced. However, this may lead to wastage of space on the output page as some fish have long descriptions, while others have short ones. FastReport has some properties which allow us to resolve this problem.
These properties allow a band or an object to automatically adjust its height to create the necessary space for a given record (row). To achieve this, we just need to enable the “Stretch” property of both the band and the “Text” object. However, that is not quite all, because a “Text” object with longer text should be able to stretch by itself we’ll need to set some of its other properties too.
The “Text” object can automatically set its height and width to make space for its contents. “AutoWidth” and “StretchMode” can be used for this. “AutoWidth” allows the “Text” object to vary its width so that all the lines make space without splitting any words. This mode is useful when an object has a single text line and when growth to the right will not affect other objects. The “Stretch” property allows the object’s height to grow to accommodate the text without changing the object’s width. “Stretch” has several modes which can be selected in the object inspector:
smDontStretch – don’t stretch the object (the default)
smActualHeight – stretch the object so it makes room for the whole text
smMaxHeight – stretch the object so that its bottom reaches the bottom of the band in which it is placed.
Here we are interested in the “Stretch” property of the “Text” object. Enable it using the object’s context menu or by setting “StretchMode” to smActualHeight. Also, enable the band’s “Stretch” property. Preview the report and make sure that everything is now as expected.
Report with two data levels
Let’s look at how to design a two data level report. The report will output data from the demo tables: “Customer” and “Orders”. The first table is a list of customers and the second one is a list of orders placed by those customers. The tables contain data in the following fields:
Customer:
CustNo Company
1221 Kauai Dive Shoppe
1231 Unisco
1351 Sight Diver
….
Orders:
OrderNo CustNo SaleDate
1003 1351 12.04.1988
1023 1221 01.07.1988
1052 1351 06.01.1989
1055 1351 04.02.1989
1060 1231 28.02.1989
1123 1221 24.08.1993
….
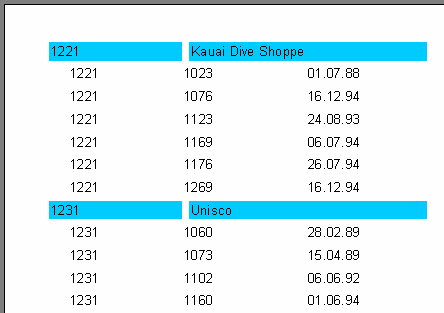
As you can see, the second table contains the list of all the orders placed by all the customers. To view the orders from the Orders table which are placed by one customer in the Customers table, the two tables are linked on the “CustNo” field, which is common to both tables. The report output from this data should appear as follows:
1221 Kauai Dive Shoppe
1023 01.07.1988
1123 24.08.1993
1231 Unisco
1060 28.02.1989
1351 Sight Diver
1003 12.04.1988
1052 06.01.1989
1055 04.02.1989
Let’s design the report. Create a new project in Delphi, place two “TTable”, one “TDataSource”, two “TfrxDBDataSet” and one “TfrxReport” components on the form. Set the component properties as shown here:
Table1:
DatabaseName = ‘DBDEMOS’
TableName = ‘Customer.db’
Table2:
DatabaseName = ‘DBDEMOS’
TableName = ‘Orders.db’
DataSource1:
DataSet = Table1
frxDBDataSet1:
DataSet = Table1
UserName = ‘Customers’
frxDBDataSet2:
DataSet = Table2
UserName = ‘Orders’
In the report designer, enable the data sources in the “Report>Data…” dialogue. Now add a “MasterData” and a “DetailData” band to the page:
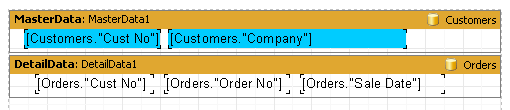
Note that the “MasterData” band must be placed above the “DetailData” band! Drag it there if necessary. If the Master is placed under the Detail, FastReport will generate an error message when you preview the report.
If you previewed the report now, you would see that the list of orders remains the same for every customer and contains all the records from the “Orders” table. This would be because we have not set the MasterSource property of the “Orders” table. Set “MasterSource = DataSource1” for the “Table2” component.Now we have set a ‘master-detail’ relationship. After that, we select the fields to link on. Set the “MasterFields” property of the “Table2” component:
We need to link together the “CustNo” fields in the two sources. To do this, select the desired fields and click the “Add” button. The Field link will appear in the bottom pane. Finish by closing the editor using ОК.
When creating the preview FastReport does the following. After a record is an output from the master table (Customer), it sets the filter on the detail table (Orders). Only those records which meet the ‘Orders.CustNo = Customer.CustNo’ condition will remain in the table. This means that for each customer only those orders which belong to the current customer will be displayed in the detail band. This is an important concept to grasp. Even though data bands may be of master or of detail type, they only control the positioning of the data on the output page (order and number of times displayed). The data displayed by the objects in the bands is dependent on which fields the objects are linked to and on the external linking of the two tables.
This is the final output:
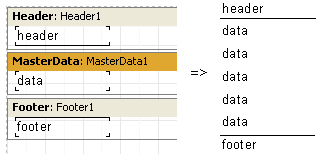
Each data band may have a header and a footer. Headers are output first, then all the records in the data band, and finally the footers. Here is an example of how the headers and footers work in a simple report:
Let’s look at a more complex example using two data levels – master and detail:
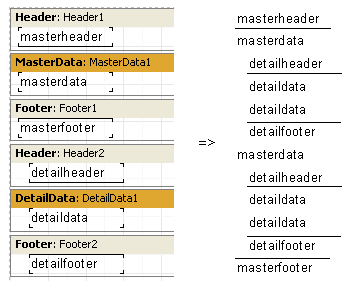
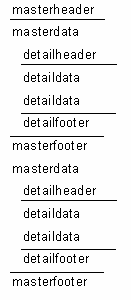
As you can see, the header is output before all data band records. So the master data header is output once at the beginning of the report and a detail data header is an output before each group of detail bands belonging to the current master record band. The detail footer is output after the group of detail bands belonging to the master record band and the master footer is not output until after all the master data band records have been output.
Using the FooterAfterEach property of the data band, we can override this behavior. Setting this property to True (you may also use the context menu for the data band – “Footer After Each Row”) causes footer output after each data row. This may be useful in the design of some master-detail reports. If FooterAfterEach for the master data band is set to True the report will look like this:
Multi-page reports
A FastReport report can consist of several design pages. Multi-page designs allow for the adjustment of properties such as size and orientation of each page, as well as allowing variation in the placement of objects and bands on the pages. When this type of report is output all bands from the first design page are be displayed, then bands from the second page, and so on.
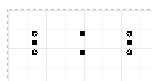
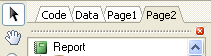
When a new report is created in the designer it contains one page by default. You can add a new page by clicking on the ![]() button in the toolbar or by selecting the “File>New page” menu command. Then you would see that a new page tab appears in the designer:
button in the toolbar or by selecting the “File>New page” menu command. Then you would see that a new page tab appears in the designer:
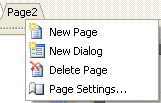
You can easily switch between pages by clicking on the page tabs. Page tabs can be dragged (“drag&drop”) to easily change their printing order. An unnecessary page can be deleted using the ![]() button in the toolbar or by selecting the “Edit>Delete page” menu command. You can also call the context menu by right-clicking on the page tab:
button in the toolbar or by selecting the “Edit>Delete page” menu command. You can also call the context menu by right-clicking on the page tab:
The number of design pages in a report is unlimited. As a rule additional pages are used either for title pages or, in more complicated reports, for data coming from many data sources.
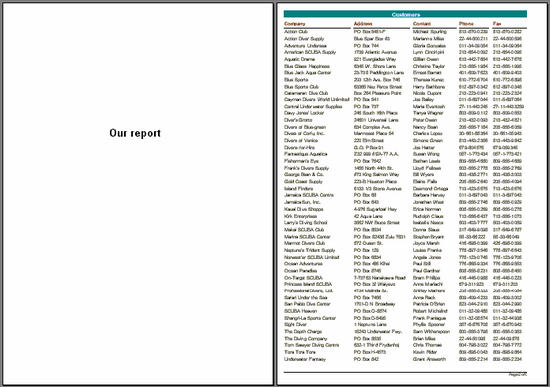
Here is a simple example of creating a title page. Let’s use our previous report having one data level. Add a new page to it, it will be added as a second page. Move it to the front of the report by grabbing the page2 tab with the mouse and dragging it over the first-page tab, page1. This changes the page order. Select the new page and place a “Text” object containing “Our report” in the middle of the page. That is all that is needed. The report with a title page is complete: